
Unintended Consequences
NASA: CO2 Sources
People are not intentionally releasing excess greenhouse gases because they want the atmosphere, land and ocean to be warmer. We are releasing excess greenhouse gases and therefore inadvertently and unintentionally causing a problem - a big problem. The excess CO2, methane, and nitrous oxide that cause global warming come from burning fossil fuels like coal, oil, and natural gas. They also come from unsustainable agricultural practices, making cement, smelting iron and aluminum, cutting down forests, and burning wood. All these practices release greenhouse gases into the air. These gases are termed greenhouse gases because they trap heat radiating back toward space from the sun-warmed earth. The rate of global warming increases as the world warms because there are feedback effects. Warm air can hold more water vapour - a potent greenhouse gas. As the world warms there is less ice and snow to reflect heat, so the dark earth or water absorbs heat and adds to the problem. Once we begin to warm the world, the whole thing goes faster and faster which in turn makes it increasingly difficult to keep it under control. And because nobody really wants to give up all the wonders of the modern world, we need to find good ways to stop the release of excess greenhouse gases without too much disruption.The CAUSES OF GLOBAL WARMING
Introduction
This section will provide a great deal of information, some of it requires an understanding of basic math, a little bit of chemistry and physics, but not so much that it is difficult to understand. We have tried to interpret the scientific information in everyday terms. If you have a question or comment, feel free to use the contact form - we will try to respond quickly. You can also discuss your questions or ideas in the forum.
The immediate cause of global warming is that humans are burning fossil fuels at such a high rate that the excess carbon dioxide (CO2), which is a greenhouse gas, has begun to accumulate in the environment because the normal carbon sinks (e.g.ocean, soil, and plants) have reached their capacity to absorb CO2. Changing this situation and finding ways to eliminate the release of the excess CO2 has become the "global warming problem." Although the main cause of the current warming is known, there are other factors that contribute to this change as well. This page explores many of the inter-related causes of global warming. Use this index to jump to a specific section or peruse the whole page at your convenience.
The Greenhouse Gas Effect
Our planet is a big rock with a lot of water about 93 million miles (150 million km) from the sun. It is an important big rock, because it is our one and only home.
The sun’s light hits the Earth and warms the land, sea and air. The atmosphere helps to keep some of that heat from radiating back into space. If our Earth had no atmosphere, there would also be no ocean. Our temperatures would be about 1230C in the daytime and -1530C at night. How do we know that? There are several ways, including calculating the sun's energy and the blackbody characteristics of the planet, but the simplest way is just to look at the moon. The moon is the same distance away from the sun as we are, but it has no atmosphere - andno ocean. The equatorial temperatures from day to night range from 1230C to -1530. At the poles the temperatures can be as low as -2400C. So having an atmosphere is a very important reason why opur planet is so comfortable for us. It is also the mechanism to trap and hold the heat.

Our one and only planet

Shapes of the main greenhouse gas molecules, all of which have at least three atoms.
Fortunately we do have an atmosphere, and that’s why we are not alternately boiling and freezing every 24 hours. Nitrogen and oxygen are the most abundant gases in the atmosphere, but they don’t really do much to warm the atmosphere. However, some of the other trace gases in the atmosphere have a remarkable capacity to trap heat. This heat trapping ability is called the “greenhouse effect.” These other greenhouse gases (GHGs) are ranked from highest to lowest in terms of heat-trapping capacity in the following order: water vapour, carbon dioxide, methane, and nitrous oxide. The most important gas that regulates temperature is water vapour, and the amount of water vapour in the air depends on the temperature. If it is cold, the air can’t hold as much water vapour as when the air is warm. If the temperature falls, the water vapour comes out of the air as dew, mist, rain, or snow. In areas where the water vapour is low, such as over deserts, the temperatures vary a great deal between night and day, whereas over the ocean, for example, the variation from night to day is much more limited.
It is very lucky that our atmosphere also has CO2. CO2, like water vapour, traps some of the heat that our Earth would otherwise radiate back into space. We don’t want too much greenhouse effect and we don’t want too little – too much in either direction would be very bad. Mars, for example has very little CO2 in its atmosphere and almost no water vapour. The surface of Mars is frozen. Venus, by contrast, has way more CO2 than the Earth's atmosphere (300 times as much), and its surface is hot enough to melt lead. So we want to keep the greenhouse gas effect under control if we can. Calculating the impact of CO2 and other GHGs is complex.
A short video at the end of the page explains this, but be prepared for some explanation using math! The picture below is easier to understand.
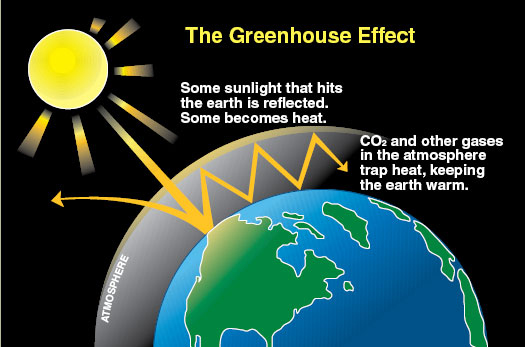
We need to have a balance between the energy gained and the heat lost. So if energy is gained, the temperature must go up. If we put all of this information together - the sun's incoming energy, the reflection from both the clouds and the surface of the land, plants, and ocean, as well as the heat that is radiated back into space from our planet, and finally the heat trapping effect of the greenhouse gases in the atmosphere, we get a complicated story, for sure. But the end result is that there is more energy coming into the system than is leaving. And that excess energy is what causes global warming.
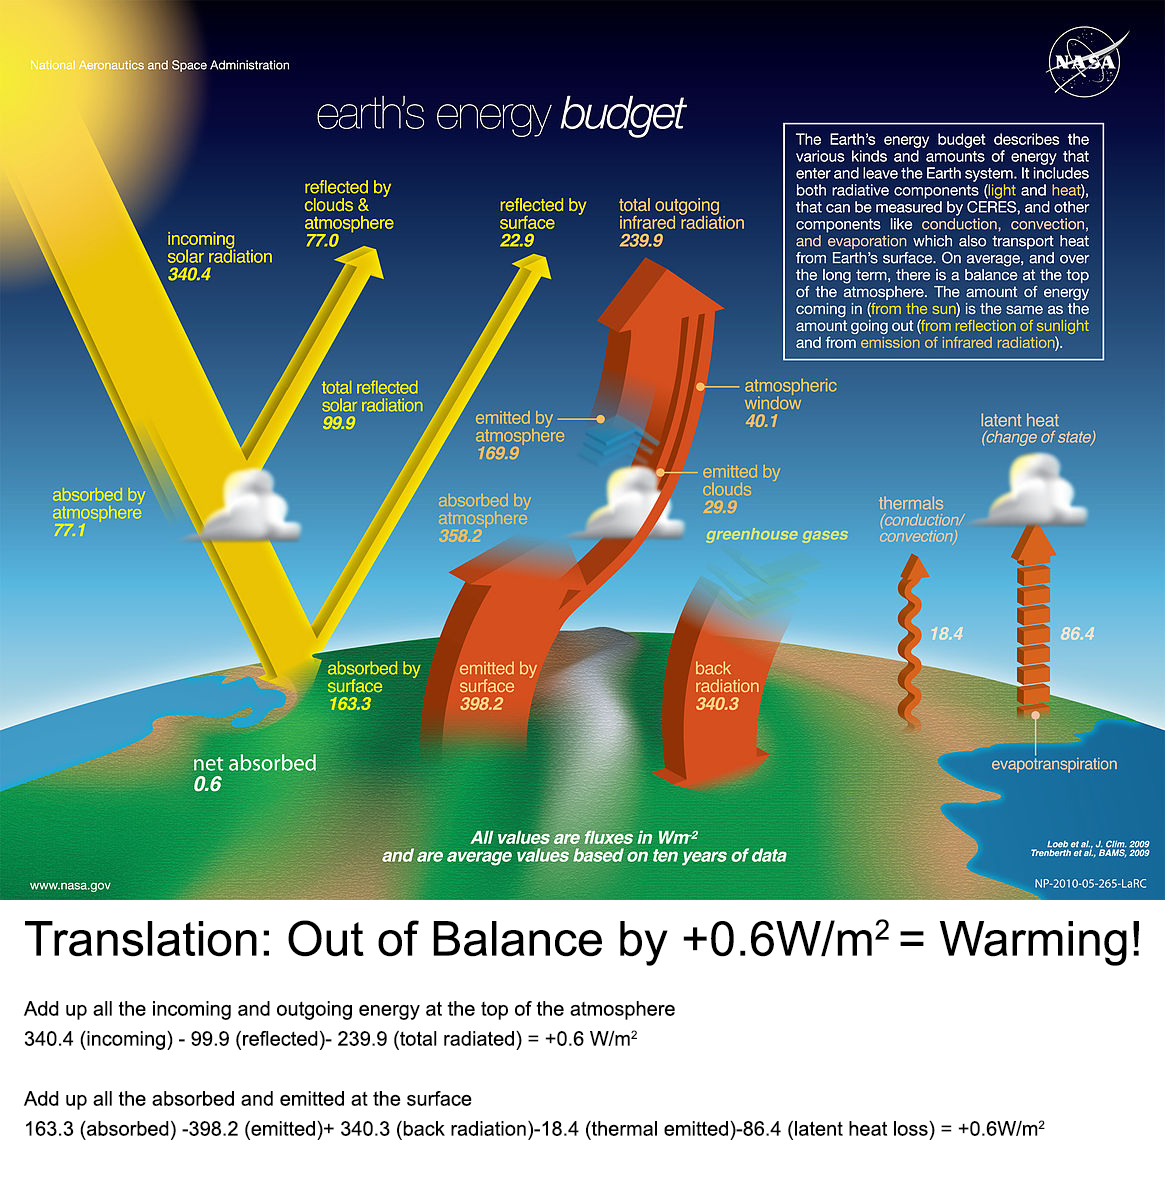
This is a diagrammatic "model" of the incoming and outgoing energy of our planet. If you look carefully in the lower left corner, you will see the sum of all the the numbers is a net energy input of 0.6 watts per meter squared (W/m2) on average over the entire surface of the planet. How much energy is that? It is approximately equal to 5 Hiroshima-sized bombs going off every second somewhere on the planet. How many bombs is that a year - let's do the arithmetic: 5 bombs x 60 seconds x 60 minutes x 24 hours x 365 days = 157,680,000. That is the equivalent amount of energy added to our planet of one hundred and fifty seven million, six hundred and eighty thousand atomic bombs every year.
The Major Sources of Global Warming
The sun is the most important source of heat external to the planet. The interior of the Earth is kept warm by radioactive decay of elements and through frictional heating due to rotation of the Earth's core of molten materials. Sometimes these materials erupt into the atmosphere in the form of volcanos and lava fields releasing large amounts of ash, CO2 and water vapour. Ozone (O3) is also a greenhouse gas and is formed naturally in the upper atmosphere. Particles of sulphate from a variety of sources, some natural and some man-made, can cause clouds to form. Clouds, thermals (upward currents of air), and evaporation as well as the action of plants also have an effect on the heat balance of the Earth. If we compare the effects of both natural and human sources of heat, we see that the major cause of the current warming trend is greenhouse gases; not volcanoes, not ozone, not sulphates, and not changes in solar energy. The only components of the climate system that correlate to the changing temperature are increasing levels of greenhouse gases.
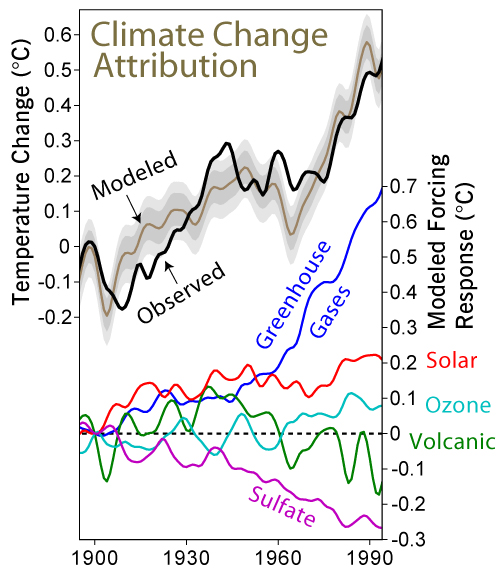
The results of a global climate model showing the effects that each factor has on average global temperature, individually (right hand scale) and combined (left hand scale). The grey bands show the 68% and 95% range of internal variation. The model has produced a reasonable match with the actual temperature record ( Meehl, Gerald A.; Washington, Warren M.; Ammann, Caspar M.; Arblaster, Julie M.; Wigley, T. M. L.; Tebaldi, Claudia (2004). "Combinations of Natural and Anthropogenic Forcings in Twentieth-Century Climate". Journal of Climate 17: 3721–7, figure courtesy of Robert Rhodes)
This graph is a bit complicated. The top two lines are the observed average temperature anomaly of the atmosphere compared to climate models - pretty close. The climate models calculate the relative effects of each heat factor. Sulphates and volcanoes are diminishing in effect. There are slight rises in solar radiation and ozone concentration, but the one that is most correlated to temperature change is greenhouse gases. So the next logical question is where do the greenhouse gases come from?
Natural Sources of CO2
Natural sources of CO2 remain balanced for many thousands of years, shifting only gradually as natural changes in the sun’s radiation levels and the changing shape of the Earth’s orbit create warm and cold cycles. Here is a typical picture of the natural sources of CO2 which are under normal conditions re-absorbed annually into the ocean, the soils and the plants.

People-Caused CO2
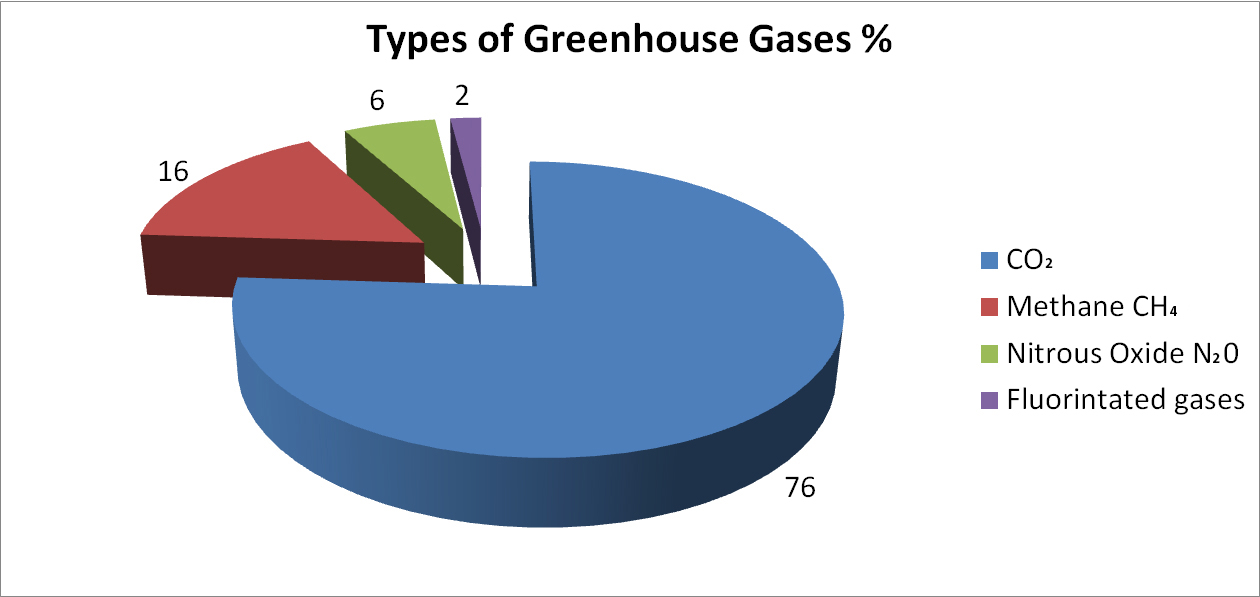
Since the onset of the Industrial Revolution, CO2 is released into the atmosphere in an unnaturally rapid fashion because people have dug up vast quantities of decayed fossil plant and animal material in the form of coal, oil and natural gas, that had been buried for many millions of years, and are burning them to produce heat and electricity; to power human activities. Here is a chart showing the approximate proportion of where the CO2 is produced by humans.

Other Greenhouse gases
As noted above, not all greenhouse gas effects on cliomate are all attributed to CO2. The most abundant greenhouse gas is actually water vapour. Water vapour however, does not accumulate in the atmosphere like the other greenhouse gases. Instead its concentration in the atmosphere is dependent on temperature. When the humidity is too high, it rains, or snows, or turns to mist. Water is a “feedback” gas, because if the overall temperature rises, the overall amount of water in the air can increase and that allows even more water vapour, which in turn causes a further increase in temperature.
Other important greenhouse gases include methane (CH4), nitrous oxide (N2O) and fluorinated carbon gases, which replaced the chloro-fluorinated carbon gases that caused holes in the Earth's ozone layer in the latter half of the 20th century.
FOSSIL FUEL USE
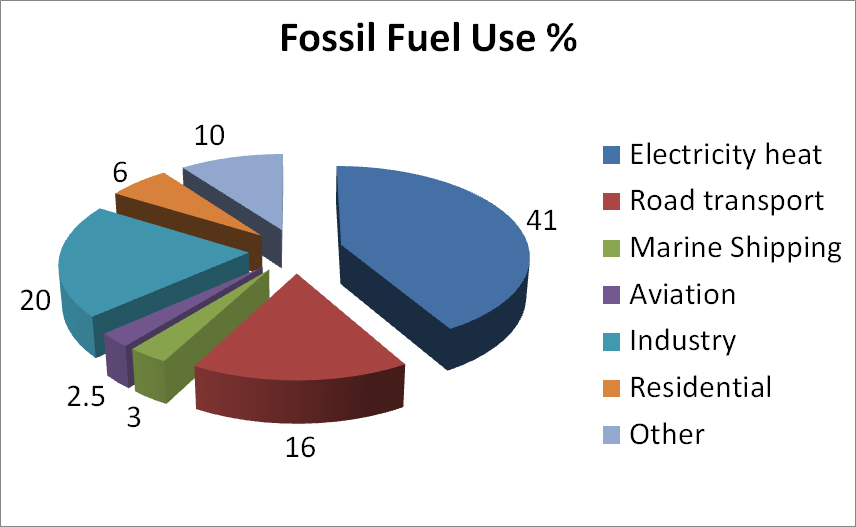
Fossil fuels are so pervasive in our society today that we almost ignore their presence except when we need more. When we think about reducing our consumption of fossil fuels, we need to consider what would be the most sensible target to have the greatest positive effect as we try to scale down the use of fossil fuels. Here is a chart of the major uses of fossil fuels.
We can see that the three biggest sources are for heat and electricity, transportation, and general industrial uses that are heat intensive (e.g. paper making, cement production and steel manufacturing. Electricity for most of the world is delivered from centralized power stations over a grid network to individual users. To reduce the use of fossil fuels, it makes sense to consider transitioning from major electrical power generating sources that use fossil fuels to some other form of energy that does not produce a carbon by-product. Cars and trucks use gasoline derived from petroleum as a liquid fuel. Alternatively, one could use cars that are driven by fuel cells or by electric batteries. Moreover, once the electrical charging source for the batteries is no longer dependent on fossil fuels, transportation systems can dramatically reduce their carbon footprint. In some instances, it may be reasonable to place solar panels on your house or communally on an apartment building to power these batteries.
It is not quite as easy to imagine how to deal with industrial requirements for lower carbon outputs. However, there are alternative methods, for example. Nuclear power can be used to power blast furnaces and drive steam turbines. On the other hand, it will take further innovation to solve the aviation fuels problem, although a form of diesel derived from CO2 captured from the atmosphere is possible.
Global Warming in the Past
There are many causes for global temperature changes, and they have occurred often in the geological past to cause extremes like ice ages and hot periods when there was no ice anywhere on the Earth. One of the best places to look for causes of these changes and especially the changes that are taking place around us today, is to examine the past, the distant past.
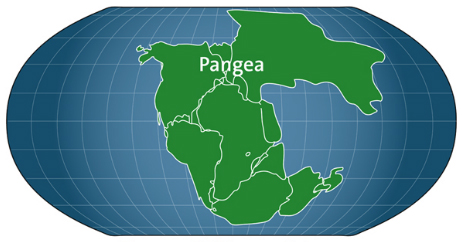
Let’s move forward and away from these very ancient times to much more recent times. To a time in the past when the planet looked essentially the same as today. All the continents were in the same location as today, but it was warmer than today. The period I am describing is called the Eemian and was about 125,000 years ago.
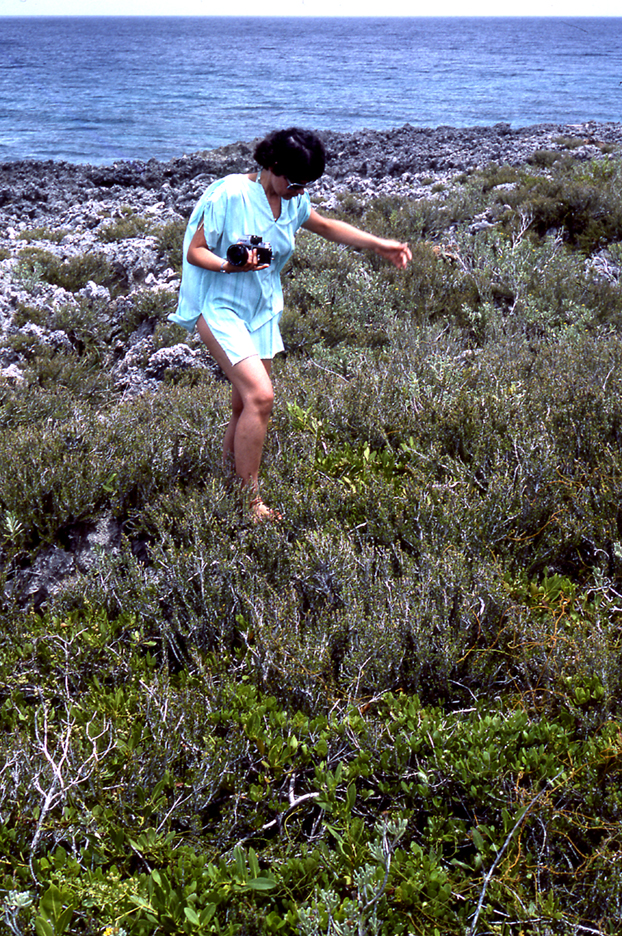
At that time the average global temperature was perhaps 30C warmer than today. With that small difference, much of, but not all of the polar ice caps melted and the ocean was about 6-9m higher than it is today. Fossil coral beds are easily seen in the Caribbean islands high above the current shoreline.
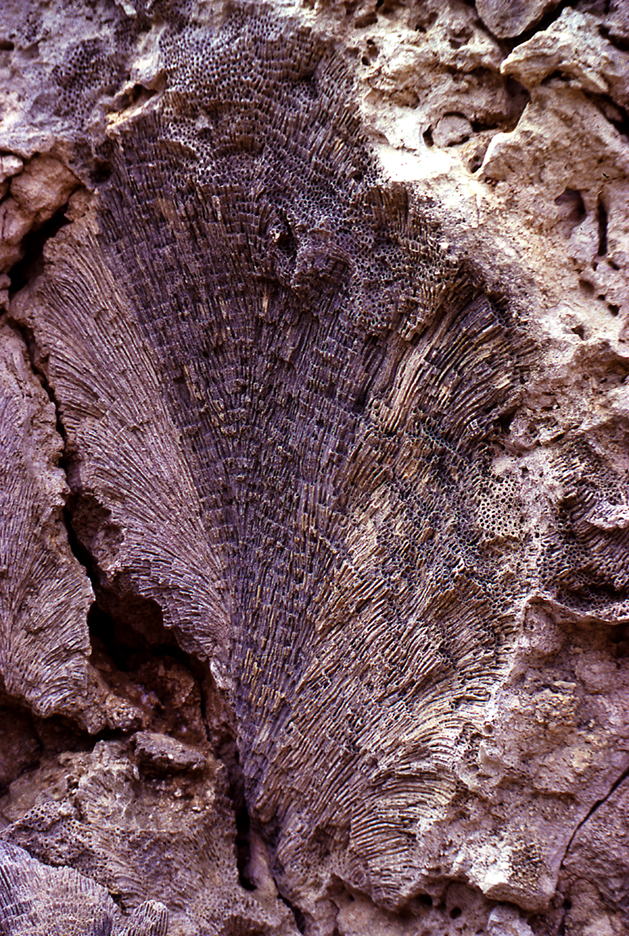
We also know from fossils that crocodiles and hippos swam where London, England would be today, so the world was warmer and the topical areas were much farther north than they are today.
Why did the Eemian get warmer than today when it was coming out of a similar ice age? A small increase in the amount of light coming from the sun caused some melting and that released some CO2 from the ocean and from the land. The more it melted, the more CO2 was released, the more water vapour could form all of which caused more increase in temperature. Because the amount of ice decreased, the surface reflection of the Earth was less; so it absorbed more heat. At that time, it happened that the amount of energy from the sun was higher than when our last ice age began to melt. So everything happened a little faster and with a little more lasting power. The result was a world much like ours, but warmer and wetter with the sea level much higher than we now. An easy way to tell that the sea level was higher is to look at the land near the ancient shorelines where coral reefs were located and you can see fossils, corals, and shells up to 9m (30 feet) above today’s shorelines.
The World Today
Once the Eemian began to cool, it stayed cold for almost 100,000 years. That was our last ice age. At the end of our last ice age, 28,000 years ago, sea level was about 120m to 150m lower than today, so there was a lot more land showing. But as the ice melted, and CO2 built up, the sea level began to rise again. It rose fairly quickly for 20,000 years until it reached a level a little below where it is today, and it has risen slowly since. Except for the higher sea levels, the beaches of the Eemian ocean would have looked very much like our own beaches.

Something triggered a very important event in the history of humans about 12,000 years ago. Was it the shift from a changing to a stable climate? Domestication of other animals and even some plants had already happened, but agriculture was new. Developed primarily in the tropical and subtropical areas, the extensive cultivation of food plants made it possible to settle into larger villages because the burden of having to send hunters and gatherers long distances to gather food was no longer needed. During the next 6,000 years, the climate warmed and cooled slightly but for the most part it was pretty stable. If we go back to the year CE1 (about 2016 years ago), there were just over 170 million people, most of whom lived in the north of India and the far East with a smattering of people scattered around the Mediterranean and the Red Sea. In the next 1,000 years, the population doubled but didn’t move around much. Five hundred years later the population rose to just under 500 million, with a few more people in Europe and Africa than previously. By 1804, our population cracked one billion people, but by far the greatest population was in the Far East and northern India. In the mid-1800s population growth in North and South America suddenly began to take off but the main centers in Europe and the Far East were also expanding rapidly.
What has all that got to do with global warming? Most people were still living on farms in the late 1800s, but the trend to increased urban living to work in manufacturing was rapidly increasing. By 1927, the world had reached 2 billion people (doubling in 123 years). Explosive growth in the use of fossil fuels allowed huge increases in manufacturing industries, and the manufacturers needed employees. In less than 50 years, the world population doubled again to 4 billion people in 1974 as fossil fuel use continued to rise rapidly. In 1985, the doubling rate began to slow down, but the production and use of fossil fuels did not slow down. Most of us now live in cities and use some form of fossil fuel for almost everything we do - heat or cool our houses, cook, bathe in warm water, run: our refrigerators, electric drills, and vacuum cleaners; go for a drive to the store. Just about everything we do uses fossil fuels either directly or indirectly through electricity.
There are some exceptions of course. A percentage of world energy; comes from water power; wind and solar energy; but as of now, wind and solar are a tiny percentage of the whole.
The History of Global Warming Research
When plants or animals die and fall to the ground, small micro-organisms start to decompose their bodies. Over time, if the somewhat slimy mess is buried along with all the other plants and animals, this incompletely decayed material becomes is crushed under the weight of the earth on top of it. As it decomposes, it makes heat and, in time, the heat and pressure transform the dead organisms into oily or lumpy substances that sometimes release gas that is also trapped with the decomposing organisms. This is natural gas, oil, and coal – what we call fossil fuels. This takes millions of years to happen, so we think of the material as a fossil- even though it no longer looks like a fossil.
It was the discovery that we could burn this material that made it possible for the industrial revolution to have enough energy to make everything. Fossil fuels are very potent sources of energy. Think of a car. A mere litre of gasoline can push your car at very high speeds for many kilometers. Imagine if you tried to duplicate the amount of power in that small bottle of gasoline by pushing the car yourself. Now imagine the power it takes to lift an airplane off the ground while 200 people are sitting in the airplane and it has to go fast enough to fly. All that power is contained in a small tank in the airplane. So fossil fuels have been a wonderful discovery for many people to enjoy a fuller more productive life and to enjoy the benefits of modern technology.
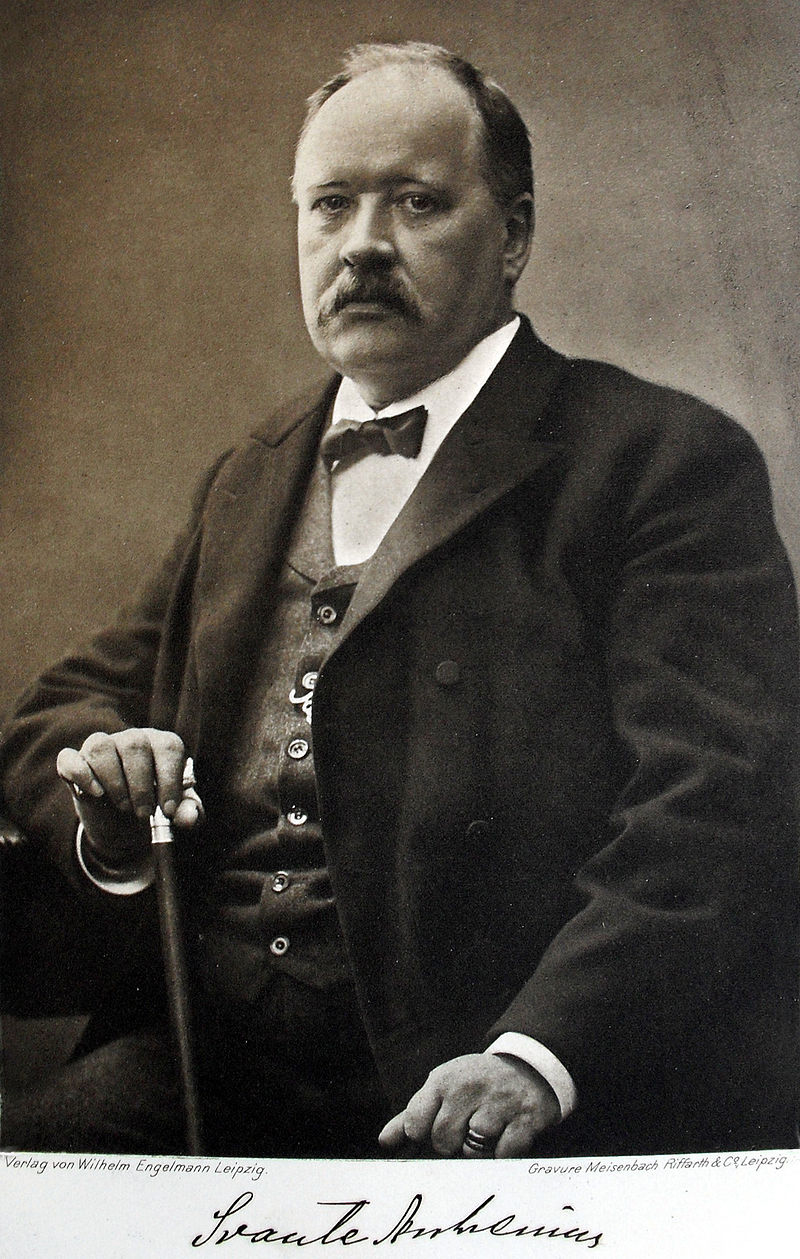
Image By Photogravure Meisenbach Riffarth & Co. Leipzig. - Zeitschrift für Physikalische Chemie, Band 69, von 1909. - Scanned, image processed and uploaded by Kuebi = Armin Kübelbeck, Public Domain
But there is a small problem with fossil fuels. Actually, it is a big problem. It is a problem we didn’t know about originally; but way back in 1896, Svante Arrhenius calculated the greenhouse effect of CO2. He was the first person to predict that emissions of CO2 from burning fossil fuels were large enough to cause global warming. Arrhenius even included the feedback from changes in water vapor.
The results were not as accurate as modern results of course, but he did predict we could have a problem from burning fossil fuels. His work is currently seen less as an accurate prediction of global warming than as the first demonstration that it should be taken as a serious possibility. Years later scientists began to understand more fully just how serious a problem the massive amount of carbon released into the atmosphere could be.
The Carbon Cycle
But wait a minute, carbon is essential to life on Earth. We are made of carbon, we eat carbon. It is part of all living organisms. Carbon is the fourth most abundant element in the universe and here on Earth, it is mostly stored in rocks. The important part for this story on global warming is where the rest of the carbon is located: it is in the ocean, atmosphere, plants, soil, and of course, fossil fuels. Unlike the carbon stored in rocks, the rest of the carbon moves around. It “cycles” between the atmosphere and plants. Plants transform sunlight and minerals using carbon from the atmosphere and soils to build their bodies. Yes, plants are basically carbon. When animals eat plants, they use the carbon in the plants to build their bodies. Most people eat both plants and animals so we are also part of the way carbon moves around. When we exhale, we release excess carbon in the form of carbon dioxide. When animals and plants die, their carbon is recycled into the air, water, and soil by micro-organisms. This flow from water to soil to air and back again is called the carbon cycle.
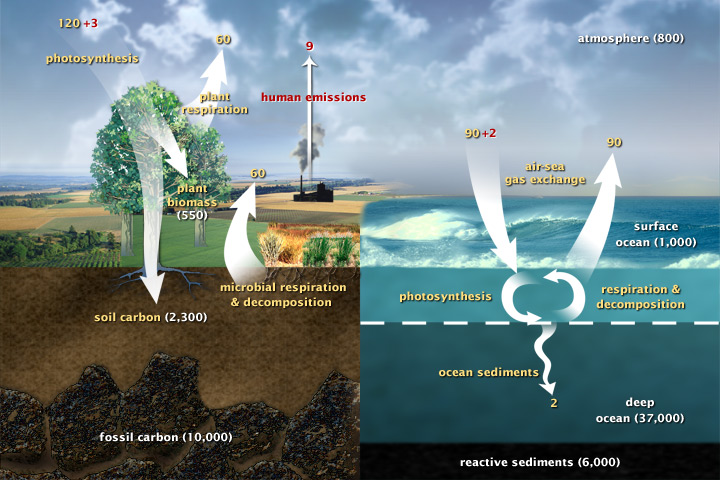
This diagram of the fast carbon cycle shows the movement of carbon between land, atmosphere, and oceans. Yellow numbers are natural fluxes, and red are human contributions in gigatons of carbon per year. White numbers indicate stored carbon. (adapted from U.S. DOE, Biological and Environmental Research Information System.)
There are parts of the cycle that are fast, and parts that operate very slowly.
The Slow Carbon Cycle
The slow carbon cycle, as you probably already guessed, is moving carbon between the rocks and the ocean, soil, or atmosphere. By slow, we mean really slow: carbon takes between 100-200 million years to move into or out of the rocks. Carbon moving from the atmosphere to the rocks starts with rain. CO2 in rainwater is slightly acid and slowly dissolves rocks. We call that “weathering. The rain water now contains some of the rock (in the form of dissolved ions). One the water reaches the ocean, the calcium ions from the dissolved rock are used by plants and animals that use it to make their skeletons or shells. After they and sink to the ocean bed, they accumulate enough that the weight and some chemical reactions binds them together to make rocks again (limestone in this case). Approximately 80 percent of carbon-containing rock is made this way today. The rest (20%) is made up of dead organisms that did not decay all the way back to simple elements. Over very long periods of time, their bodies are transformed into rock such as shale, or sometimes into oil, coal, or natural gas instead of rock.
The slow carbon cycle, as you probably already guessed, is moving carbon between the rocks and the ocean, soil, or atmosphere. By slow, we mean really slow: carbon takes between 100-200 million years to move into or out of the rocks. Carbon moving from the atmosphere to the rocks starts with rain. CO2 in rainwater is slightly acid and slowly dissolves rocks. We call that “weathering. The rain water now contains some of the rock (in the form of dissolved ions). One the water reaches the ocean, the calcium ions from the dissolved rock are used by plants and animals that use it to make their skeletons or shells. After they and sink to the ocean bed, they accumulate enough that the weight and some chemical reactions binds them together to make rocks again (limestone in this case). Approximately 80 percent of carbon-containing rock is made this way today. The rest (20%) is made up of dead organisms that did not decay all the way back to simple elements. Over very long periods of time, their bodies are transformed into rock such as shale, or sometimes into oil, coal, or natural gas instead of rock.
The slow cycle returns carbon to the atmosphere through volcanoes. The hot melted rock recombines into silicate minerals, releasing carbon dioxide. This ash falls back down onto the ground making new “silicate” rock – and the cycle starts over again. Volcanoes today spew out about 130 and 380 million metric tons of carbon dioxide per year. For comparison, humans emit about 30 billion tons of carbon dioxide per year—100–300 times more than volcanoes—by burning fossil fuels. The ocean is also part of this slow cycle.
Before the industrial age began, carbon dioxide moved out of the ocean into the atmosphere at about the same rate as the ocean received carbon dioxide during rock weathering - it was a fine balance. Now things are different. The ocean now takes more carbon from the atmosphere than it releases and that causes the ocean to become more acidic.
The Fast Carbon Cycle
While the slow carbon cycle takes up to millions of years to move carbon, the fast cycle operates on a much faster time scale. It is quick because the cycle based on the birth and death of the time it takes carbon to move through the fast carbon cycle is measured in a lifespan. The fast carbon cycle is mainly the movement of carbon through living organisms and the biosphere -- mostly plants on land and in the ocean (primarily microscopic plants called phytoplankton).
There are four ways carbon leaves a plant and returns to the atmosphere. Plants break down the sugar they made to get the energy they need to grow. Animals (including us) eat the plants to get energy. Plants and plankton die and decay (bacteria eat them). And that leaves burning the plants. Or fire consumes plants. In all four methods for plants, animals, bacteria, and fire, oxygen combines with plant sugar to release water, carbon dioxide, and energy. Because all four methods primarily release carbon into the atmosphere, we can see the planet “breathe” from season to season. During the fall and winter of the Northern Hemisphere; when few land plants are growing and many are decaying, atmospheric carbon dioxide concentrations rise because plants stop growing and some die and decay at the end of the season. In the spring, plants use the carbon to grow again, and the carbon is lowered in the atmosphere.
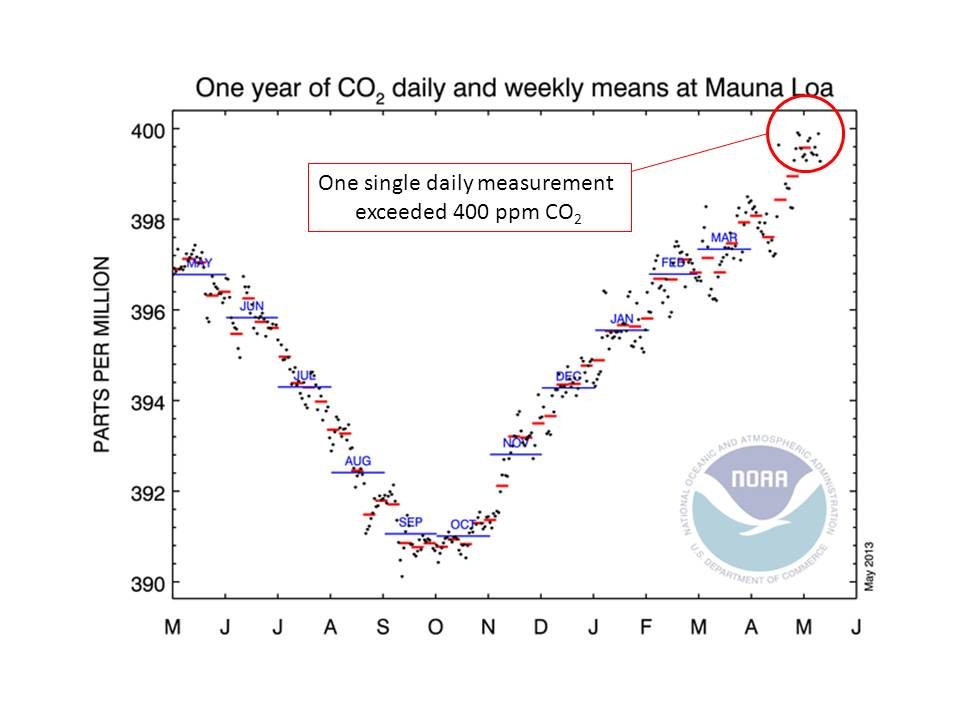
Daily carbon dioxide concentration measurements for the year to May 2013. Daily measurements are shown as black dots, weekly averages as red lines, and monthly averages as blue lines. On May 9th 2013, the daily value exceeded 400 ppm. Click for larger graph: Graphic is from NOAA Mauna Loa Observatory
NASA scientists have put together a high resolution time-lapse map of the circulation and distribution of CO2 for the year 2006 on a daily basis. The seasonal changes are easily seen and the remarkable concentration of the greenhouse gas effect in the northern hemisphere during the winter months is visually obvious.
Changes in the Carbon Cycle
The atmosphere, land, plants, and ocean are reservoirs for carbon. Sometimes they are called carbon sinks. The fast and slow carbon cycles maintain a relatively steady concentration of carbon in the atmosphere via land, plants, and ocean. But when anything changes the amount of carbon in one reservoir, the effect ripples through the others.
Today, major changes in the carbon cycle are happening because of people. When we cut down forests, the trees are no longer there to remove carbon from the atmosphere. We usually plant crops or pasture, which store less carbon than trees. Open soil from tilling the land releases carbon from decaying plants into the atmosphere. Just through land use changes alone, we release about a billion tons of carbon a year into the atmosphere.
In natural situations, the carbon in fossil fuels would leak slowly into the atmosphere through volcanic activity over millions of years in the slow carbon cycle. But by burning coal, oil, and natural gas, we release huge amounts of carbon into the atmosphere every year. We are really moving carbon from the slow cycle to the fast cycle.
People first started burning fossil fuels around the mid 1700s and that made the Industrial Revolution possible. All of this extra carbon had to go somewhere. So far, land plants and the ocean have taken up about 55 percent of the extra carbon people have put into the atmosphere while about 45 percent has stayed in the atmosphere.
Since then CO2 has risen from about 280 parts per million (ppm) to about 403 ppm today (March 2016). That’s well over 40 percent increase in less than 200 years, a mere wink in geological time; yet it has been more than 800,000 years since the Earth has had that much carbon in the atmosphere.
Glaciation and the Milankovitch cycles
Brief Summary
We are currently in an ice age. Our glacial and interglacial periods within the present Ice Age (the last couple of million years) have been caused primarily by the way the Earth travels around the sun. There are three dominant cycles: eccentricity, axial tilt, and precession. Taken together these are known as the Milankovitch Cycles. Variations in these three cycles operate together to change the amount of solar radiation reaching the Earth's surface. Times of increased or decreased solar radiation directly influence the Earth's climate system, impacting the advance and retreat of Earth's glaciers.
The Relationship between the Earth’s Journey around the Sun & Natural Climate Change
The Role of the Sun
To understand the relationship between the Earth’s journey around the Sun and natural climate change, we must first establish if the amount of solar energy the Earth receives from the Sun is constant or varies over time. Since the Sun is the principal source of the radiant energy the Earth receives from space, it is useful to know if the solar energy flux or solar irradiance, the amount of energy arriving per unit time, varies and if so, then to what degree, in what way, and over what timescales (e.g., are there specific periods or cycles of variation at least over timescales since the rise of human civilization).[1]
The Solar Constant
The value of the radiant energy received from the Sun is called the ‘solar constant’. It is a measure of the mean solar electromagnetic radiation arriving per unit area that would be incident on a plane perpendicular to the Sun’s rays, at a distance of one astronomical unit (AU) from the Sun. Because the Earth’s orbit is not circular, there are times in the year when the Earth is closer to the Sun that at other times, hence the AU is a measure of the mean distance.[2]
The solar constant includes all types of solar radiation, not just visible light. However, the solar constant is not a physical constant such as the speed of light, which in physics is considered to be an absolute constant in accordance with Einstein’s Theory of Relativity. In reality, the solar constant is an average of a varying value that for some 400 years of observations has not changed by more than 0.2 percent.
So, why does it vary? The primary reason for this small variation over the past four centuries is attributable to minor changes in the amount of solar energy received at the Earth because of sunspot cycles. Sunspots are darker regions of the Sun relative to its general brightness. The darker regions reduce the amount of radiant energy coming from the Sun as they are cooler than most of the solar surface. The cycle varies from no spots to many spots to no spots in an approximately 11-year cycle. The current and previous two cycles are illustrated in Exhibit 1.
Exhibit 1

[1] The solar irradiance integrated over time is called solar irradiation, solar exposure or insolation.
[2] An AU is the mean distance from the Sun to the Earth over the course of a year, the time it takes the planet to travel around the Sun. In 2012, an Astronomical Unit was defined as a specific length, that being 149.597870700 million km or for practical purposes 150 million km.
Read more about the Fascinating Milankovitch Cycles.....
The Greenhouse Gas Effect
The greenhouse gas effect can be complicated to understand. It is important because it is the mechanism that causes global warming. By adding excess CO2 from fossil fuels, poor forestry practices, poor agricultural practices, and using carbon-intensive industrial processes, we enable the greenhouse gas effect to increase our planet's average temperature. Too much of this is going to be a very bad idea, so understanding what is happening is smart. Here are some details with a "sort of" simple explanation to start with.
The sun heats up the plants, the earth, lakes, the air and the ocean. Because the earth gets warm, it radiates heat away from itself back toward space. Infrared radiation is part of the spectrum of light, so the wavelengths of infrared are just colours we can't see with our eyes. But we can see it with instruments that are sensitive to those wavelengths. Imagine yourself in space looking back at the planet earth, but also imagine that you have eyes that can see infrared wavelengths. If there were no atmosphere, you could see all the wavelengths of infrared (the colours of heat) displayed as the earth radiates its heat (infrared) back out to space. If we add an atmosphere that contains a little bit of water vapour, ozone, methane, nitrous oxide, and carbon dioxide. Now we can still see some of the infrared, but some of the colours of heat have disappeared and some are not as bright. If we add more of these gases, we still see infrared, but now more colours are completely gone and more are dimmed. The less infrared we can see from space, the warmer the surface of the planet and the atmosphere must become because that infrared is also heat!